|
|
|
|
|
|
|
|
|
|
|
|
|
Communiqué on the Fourth National Economic Census (No. 2) | | 第四次全国经济普查公报(第二号) |
| ---- Basic Situation of the Units | | --单位基本情况 |
| (National Bureau of Statistics of China, Office of the Leading Group of the State Council for the Fourth National Economic Census, November 20, 2019) | | (国家统计局 国务院第四次全国经济普查领导小组办公室 2019年11月20日) |
| Based on the results of the fourth national economic census, the data of basic situation of units, persons employed, assets and liabilities, and business revenue are released as follows: | | 根据第四次全国经济普查结果,现将我国单位的基本情况、从业人员、资产负债状况和营业收入公布如下: |
| I. Basic Situation of the Units | | 一、单位基本情况 |
| By the end of 2018, there were 21.789 million legal entities in the secondary and tertiary industries, an increase of 10.932 million or up by 100.7 percent compared with that at the end of 2013 (2013 was the year for the Third National Economic Census); 24.550 million establishments, an increase of 11.515 million or up by 88.3 percent; and 62.959 million self-employed (see Table 2-1). | | 2018年末,全国共有从事第二产业和第三产业活动的法人单位2178.9万个,比2013年末(2013年是第三次全国经济普查年份,下同)增加1093.2万个,增长100.7%;产业活动单位2455.0万个,增加1151.5万个,增长88.3%;个体经营户6295.9万个(详见表2-1)。 |
Table 2-1 Number of Units and Self-employed
Number of Units (10,000) | Proportion (%) |
| 1. Legal Entities | 2178.9 | 100.0 | Corporate Enterprises | 1857.0 | 85.2 | Government Departments and Institutions | 107.5 | 4.9 | Social Organizations | 30.5 | 1.4 | Others | 183.9 | 8.4 | 2. Establishments | 2455.0 | 100.0 | Secondary Industry | 484.1 | 19.7 | Tertiary Industry | 1970.9 | 80.3 | 3. Self-employed | 6295.9 | 100.0 | Secondary Industry | 732.3 | 11.6 | Tertiary Industry | 5563.6 | 88.4 |
By the end of 2018, the top three sectors in terms of number of legal entities in the secondary and tertiary industries were: wholesale and retail with 6.499 million entities, or 29.8 percent of the total; manufacturing with 3.270 million, or 15.0 percent; and leasing and business services, 2.551 million entities or 11.7 percent. Among self-employed, the top three sectors were: wholesale and retail, 31.846 million, taking up 50.6 percent; hotels and catering services, 7.591 million, taking up 12.1 percent; and transport, storage and post, 5.804 million, taking up 9.2 percent (see Table 2-2).
Table 2-2 Number of Legal Entities and Self-employed by Sector
Legal Entities | Self-employed |
| Number of Units (10,000) | Proportion (%) | Number of Units (10,000) | Proportion (%) |
| Total | 2178.9 | 100.0 | 6295.9 | 100.0 | Mining | 7.0 | 0.3 | 1.8 | 0.0 | Manufacturing | 327.0 | 15.0 | 448.0 | 7.1 | Production and Supply of Electricity, Heat Power, Gas and Water | 11.1 | 0.5 | 8.9 | 0.1 | Construction | 121.8 | 5.6 | 288.5 | 4.6 | Wholesale and Retail | 649.9 | 29.8 | 3184.6 | 50.6 | Transport, Storage and Post | 57.7 | 2.6 | 580.4 | 9.2 | Hotels and Catering Services | 43.1 | 2.0 | 759.1 | 12.1 | Information Transmission, Software and Information Technology Services | 92.0 | 4.2 | 21.1 | 0.3 | Financial Services | 13.8 | 0.6 | - | - | Real Estate | 74.5 | 3.4 | 82.9 | 1.3 | Leasing and Business Services | 255.1 | 11.7 | 130.8 | 2.1 | Scientific Research and Technology Services | 127.6 | 5.9 | 18.3 | 0.3 | Water Conservancy, Environment and Public Utility Administration | 14.9 | 0.7 | 3.1 | 0.0 | Households Services, Repair and Other Services | 49.7 | 2.3 | 547.6 | 8.7 | Education | 66.6 | 3.1 | 32.4 | 0.5 | Health and Social Services | 27.3 | 1.3 | 57.6 | 0.9 | Culture, Sports and Entertainment | 56.7 | 2.6 | 63.2 | 1.0 | Public Management, Social Security and Social Organization | 159.7 | 7.3 | - | - |
Note: The total number in the table above includes legal entities and self-employed that undertake professional and supporting activities to agriculture, forestry, animal husbandry and fishery, and legal entities and self-employed in agriculture, forestry, animal husbandry and fishery that are engaged concurrently in the secondary and tertiary industries.
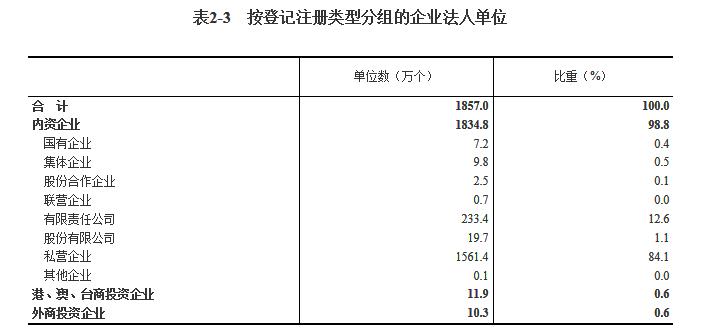
By the end of 2018, there were 18.570 million corporate enterprises in the secondary and tertiary industry, an increase of 10.362 million or up by 126.2 percent compared with that at the end of 2013. Of the total, domestic funded enterprises accounted for 98.8 percent, enterprises funded by investors from Hong Kong, Macao and Taiwan for 0.6 percent and foreign funded enterprises for 0.6 percent. Among the domestic funded enterprises, state owned enterprises took up 0.4 percent and private enterprises 84.1 percent (see Table 2-3).
Table 2-3 Number of Corporate Enterprises by Status of Registration
Corporate Enterprises (10,000) | Proportion (%) |
| Total | 1857.0 | 100.0 | Domestic Funded Enterprises | 1834.8 | 98.8 | State-owned Enterprises | 7.2 | 0.4 | Collectively-owned Enterprises | 9.8 | 0.5 | Shareholding Cooperative Enterprises | 2.5 | 0.1 | Joint Ownership Enterprises | 0.7 | 0.0 | Limited Liability Corporations | 233.4 | 12.6 | Shareholding Corporations Limited | 19.7 | 1.1 | Private Enterprises | 1561.4 | 84.1 | Other Enterprises | 0.1 | 0.0 | Enterprises Funded by Investors from Hong Kong, Macao and Taiwan | 11.9 | 0.6 | Foreign Funded Enterprises | 10.3 | 0.6 |
| |  |
II. Employed Persons
By the end of 2018, there were 383.236 million persons employed by legal entities in the secondary and tertiary industries, an increase of 27.213 million or up by 7.6 percent compared with that at the end of 2013; of the total, 144.467 million were female employees. There were 172.558 million persons in the secondary industries, a drop of 20.050 million or down by 10.4 percent. There were 210.677 million persons in the tertiary industries, an increase of 47.262 million or up by 28.9 percent. About 149.312 million persons were employed by self-employed units, of whom, the number of female employees was 69.009 million.
Among the legal entities, the top three sectors in terms of employed persons were manufacturing, taking up 27.3 percent with 104.713 million employees; construction, taking up 15.2 percent with 58.091 million employees; and wholesale and retail, taking up 10.5 percent with 40.085 million employees. Among the self-employed, the top three were wholesale and retail, taking up 43.2 percent with 64.432 million employees; hotels and catering services, taking up 15.0 percent with 22.353 million employees; and manufacturing, taking up 11.0 percent with 16.374 million employees (see Table 2-4).
Table 2-4 Number of Employed Persons of Legal Entities and Self-employed by Sector
| Employed Persons of Legal Entities (10,000) |
| Employed Persons of Self-employed (10,000) |
| Of whom: Females | Of whom: Females | Total | 38323.6 | 14446.7 | 14931.2 | 6900.9 | Mining | 596.0 | 105.8 | 8.5 | 1.2 | Manufacturing | 10471.3 | 4136.4 | 1637.4 | 780.9 | Production and Supply of Electricity, Heat Power, Gas and Water | 466.9 | 126.1 | 14.9 | 4.5 | Construction | 5809.1 | 780.5 | 950.3 | 164.4 | Wholesale and Retail | 4008.5 | 1779.1 | 6443.2 | 3325.0 | Transport, Storage and Post | 1434.8 | 364.2 | 1173.0 | 192.1 | Hotels and Catering Services | 706.9 | 401.4 | 2235.3 | 1223.2 | Information Transmission, Software and Information Technology Services | 1010.7 | 380.6 | 44.8 | 22.5 | Financial Services | 1831.6 | 1053.0 | - | - | Real Estate | 1268.9 | 514.3 | 171.7 | 78.8 | Leasing and Business Services | 2290.1 | 823.1 | 299.3 | 116.1 | Scientific Research and Technology Services | 1182.9 | 398.0 | 48.9 | 17.0 | Water Conservancy, Environment and Public Utility Administration | 353.2 | 139.4 | 7.7 | 2.8 | Households Services, Repair and Other Services | 432.9 | 204.7 | 1303.9 | 656.9 | Education | 2230.5 | 1404.1 | 138.2 | 106.4 | Health and Social Services | 1147.8 | 771.6 | 132.1 | 68.1 | Culture, Sports and Entertainment | 419.8 | 194.2 | 180.3 | 97.5 | Public Management, Social Security and Social Organization | 2508.7 | 822.0 | - | - |
Note: The total number in the table above includes employed persons working for legal entities and self-employed that undertake professional and supporting activities to agriculture, forestry, animal husbandry and fishery. | | 2018年末,在第二产业和第三产业法人单位中,位居前三位的行业是:批发和零售业649.9万个,占29.8%;制造业327.0万个,占15.0%;租赁和商务服务业255.1万个,占11.7%。在个体经营户中,位居前三位的行业是:批发和零售业3184.6万个,占50.6%;住宿和餐饮业759.1万个,占12.1%;交通运输、仓储和邮政业580.4万个,占9.2%(详见表2-2)。 |
III. Assets, Liabilities and Business Revenue
By the end of 2018, the total assets of legal entities engaged in the secondary and tertiary industries were 914.2 trillion yuan, among which, that of the secondary industries accounted for 19.0 percent and that of the tertiary industries accounted for 81.0 percent. The total liabilities of legal entities were 624.0 trillion yuan, among which, that of the secondary industries accounted for 16.1 percent and that of the tertiary industries accounted for 83.9 percent.
In 2018, the business revenue from corporate enterpises engaged in the secondary and tertiary industries were 294.6 trillion yuan, among which, that of the secondary industries accounted for 48.8 percent and that of the tertiary industries accounted for 51.2 percent (see Table 2-5).
Table 2-5 Assets, Liabilities and Business Revenue by Sector
Total Assets of Legal Entities (trillion yuan) | Total Liabilities of Legal Entities (trillion yuan) | Business Revenue of Corporate Enterprises (trillion yuan) |
| Total | 914.2 | 624.0 | 294.6 | Mining | 11.4 | 6.8 | 5.1 | Manufacturing | 106.7 | 58.9 | 105.6 | Production and Supply of Electricity, Heat Power, Gas and Water | 21.4 | 12.8 | 7.9 | Construction | 34.6 | 22.5 | 25.6 | Wholesale and Retail | 53.4 | 36.4 | 88.2 | Transport, Storage and Post | 36.2 | 21.7 | 8.6 | Hotels and Catering Services | 2.8 | 1.9 | 1.4 | Information Transmission, Software and Information Technology Services | 15.7 | 7.3 | 7.0 | Financial Services | 321.9 | 274.4 | 13.7 | Real Estate | 116.2 | 89.0 | 14.4 | Leasing and Business Services | 113.2 | 59.3 | 8.5 | Scientific Research and Technology Services | 18.2 | 9.3 | 4.5 | Water Conservancy, Environment and Public Utility Administration | 18.1 | 9.9 | 1.0 | Households Services, Repair and Other Services | 1.1 | 0.6 | 0.7 | Education | 9.6 | 1.6 | 0.5 | Health and Social Services | 5.6 | 2.3 | 0.5 | Culture, Sports and Entertainment | 4.3 | 2.0 | 1.1 | Public Management, Social Security and Social Organization | 23.1 | 7.0 | - |
Note: The total number in the table above includes entities that undertake professional and supporting activities to agriculture, forestry, animal husbandry and fishery. The corporate enterprises in the table include the legal entities registered as enterprises, as well as institutions, private non-enterprise legal entities and foundations that follow the Accounting System for Business Enterprises, specialized farmer cooperatives, rural collective economic organizations and legal entities that are categorized as other organizations excluding places for religious activities. | | 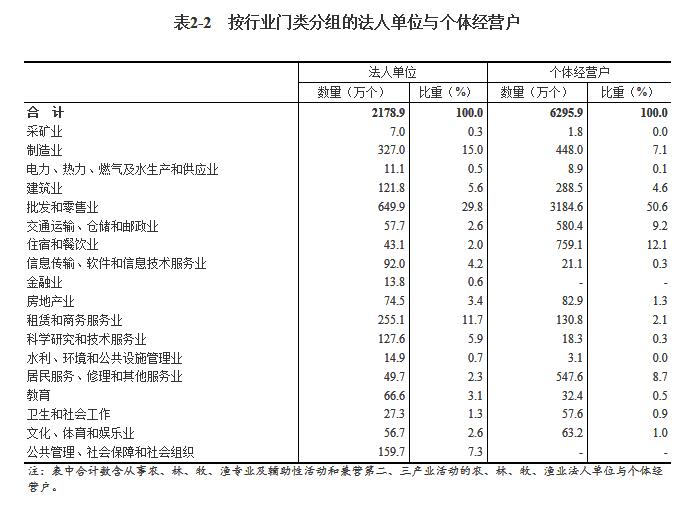 |
| Notes: | | 2018年末,全国共有第二产业和第三产业的企业法人单位1857.0万个,比2013年末增加1036.2万个,增长126.2%。其中,内资企业占98.8%,港、澳、台商投资企业占0.6%,外商投资企业占0.6%。内资企业中,国有企业占全部企业法人单位的0.4%,私营企业占84.1%(详见表2-3)。 |
[1] Classification of Industries.
...... | | 
...... |
|
Dear visitor, as a premium member of this database, you will get complete access to all content.Please go premium and get more.
1. To become a premium member, please call 400-810-8266 Ext. 171.
2. Binding to the account with access to this database.
3. Apply for a trial account.
4. To get instant access to a document, you can Pay Amount 【¥300.00】 for your single purchase. | |
您好:您现在要进入的是北大法宝英文库会员专区。
如您是我们英文用户可直接 登录,进入会员专区查询您所需要的信息;如您还不是我们 的英文用户;您可通过网上支付进行单篇购买,支付成功后即可立即查看本篇内容。
Tel: +86 (10) 82689699, +86 (10) 82668266 ext. 153
Mobile: +86 13311570713
Fax: +86 (10) 82668268
E-mail:info@chinalawinfo.com
|
| | | | | | | | |
Scan QR Code and Read on Mobile
|
|
|
|
|
|
Message: Please kindly comment on the present translation.
|
|
|
|
|
|
|
|
|
Translations are by lawinfochina.com, and we retain exclusive copyright over content
found on our website except for content we publish as authorized by respective copyright
owners or content that is publicly available from government sources.
Due to differences in language, legal systems, and culture, English translations
of Chinese law are for reference purposes only. Please use the official Chinese-language
versions as the final authority. Lawinfochina.com and its staff will not be directly
or indirectly liable for use of materials found on this website.
We welcome your comments and suggestions, which assist us in continuing to improve
the quality of our materials as we dynamically expand content.
|
|
|
|
|
|