|
|
|
|
|
|
|
|
|
|
|
|
|
Communiqué on the Fourth National Economic Census (No. 4) | | 第四次全国经济普查公报(第四号) |
| ----Basic Information of the Tertiary Industry (Part 1) | | --第三产业基本情况之一 |
(National Bureau of Statistics of China Office of the Leading Group of the State Council for the Fourth National Economic Census
November 20, 2019) | | (国家统计局 国务院第四次全国经济普查领导小组办公室 2019年11月20日) |
| Based on the results of the Fourth National Economic Census, the major data of wholesale and retail trade, transportation, storage and post, hotels and catering services, information transmission, software and information technology services, financial intermediation, real estate, and leasing and business services in the tertiary industry are disseminated as the following: | | 根据第四次全国经济普查结果,现将我国第三产业中批发和零售业,交通运输、仓储和邮政业,住宿和餐饮业,信息传输、软件和信息技术服务业,金融业,房地产业,租赁和商务服务业的主要数据公布如下: |
| I. Wholesale and Retail Trade | | 一、批发和零售业 |
| 1. Number of Corporate Enterprises and Persons Employed | | (一)企业法人单位数和从业人员。 |
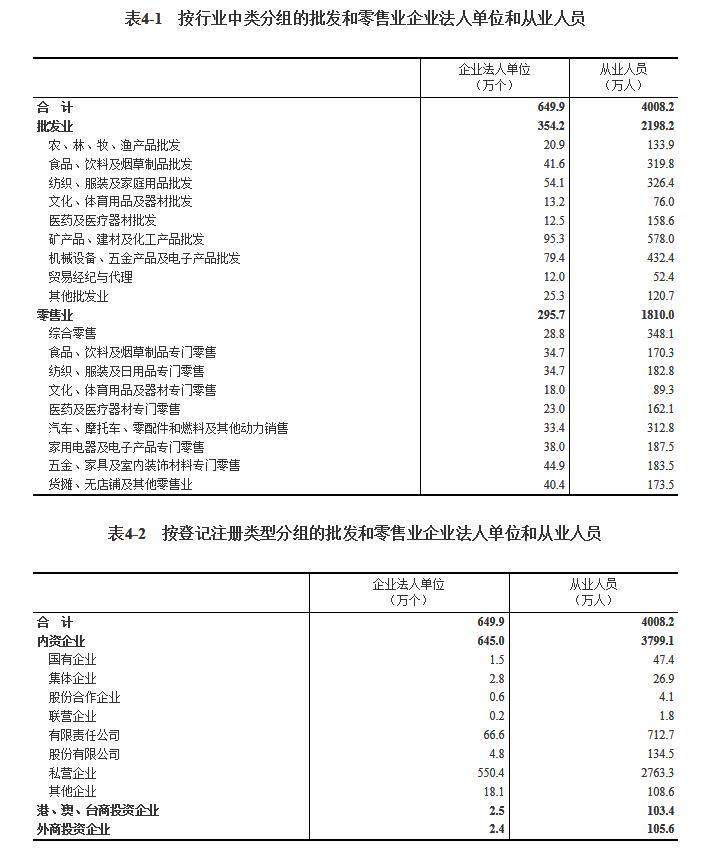
| At the end of 2018, there were 6.499 million corporate enterprises engaged in wholesale and retail trade with total number of 40.082 million persons employed, up by 131.2 percent and 20.9 percent respectively as compared with those at the end of 2013. | | 2018年末,全国共有批发和零售业企业法人单位649.9万个,从业人员4008.2万人,分别比2013年末增长131.2%和20.9%。 |
| Of the total number of corporate enterprises in wholesale and retail trade, wholesale accounted for 54.5 percent and retail trade accounted for 45.5 percent. Of the total number of persons employed, wholesale accounted for 54.8 percent and retail trade accounted for 45.2 percent. (Table 4-1) | | 在批发和零售业企业法人单位中,批发业占54.5%,零售业占45.5%。在批发和零售业企业法人单位从业人员中,批发业占54.8%,零售业占45.2%(详见表4-1)。 |
Table 4-1 Number of Corporate Enterprises and Persons Employed in Wholesale and Retail Trade by Group
| Corporate Enterprises (10,000) | Persons Employed (10,000) | Total | 649.9 | 4008.2 | Wholesale | 354.2 | 2198.2 | Agricultural, Forestry, Animal Husbandry and Fishery Products | 20.9 | 133.9 | Food, Beverages and Tobaccos | 41.6 | 319.8 | Textiles, Wearing Apparel and Household Articles | 54.1 | 326.4 | Cultural, Sports Appliances and Equipments | 13.2 | 76.0 | Medicines and Medical Appliances | 12.5 | 158.6 | Mineral products, Building Materials and Chemical Products | 95.3 | 578.0 | Machinery, Hardware and Electronics | 79.4 | 432.4 | Trade Broker and Agency | 12.0 | 52.4 | Others | 25.3 | 120.7 | Retail Trade | 295.7 | 1810.0 | Integrated Retail | 28.8 | 348.1 | Food, Beverages and Tobaccos | 34.7 | 170.3 | Textiles, Wearing Apparel and Daily Consumer Articles | 34.7 | 182.8 | Cultural, Sports Appliances and Equipments | 18.0 | 89.3 | Medicines and Medical Appliances | 23.0 | 162.1 | Motor Vehicles, Motorcycles, Parts, Fuels and other power | 33.4 | 312.8 | Household Electric Appliances and Electronic Products | 38.0 | 187.5 | Hardware, Furniture and Interior Decoration Materials | 44.9 | 183.5 | Stalls, Non-shop and Other Retails | 40.4 | 173.5 |
Table 4-2 Number of Corporate Enterprises and Persons Employed in Wholesale and Retail Trade by Status of Registration
| Corporate Enterprises (10,000) | Persons Employed (10,000) | Total | 649.9 | 4008.2 | Domestic Funded Enterprises | 645.0 | 3799.1 | State-owned Enterprises | 1.5 | 47.4 | Collective-owned Enterprises | 2.8 | 26.9 | Shareholding Cooperative Enterprises | 0.6 | 4.1 | Joint Ownership Enterprises | 0.2 | 1.8 | Limited Liability Corporations | 66.6 | 712.7 | Shareholding Corporations Limited | 4.8 | 134.5 | Private Enterprises | 550.4 | 2763.3 | Other Enterprises | 18.1 | 108.6 | Enterprises Funded by Investors from Hong Kong, Macao and Taiwan | 2.5 | 103.4 | Foreign Funded Enterprises | 2.4 | 105.6 |
Of the total number of corporate enterprises in wholesale and retail trade, domestic funded enterprises accounted for 99.2 percent, enterprises funded by investors from Hong Kong, Macao and Taiwan accounted for 0.4 percent, and foreign funded enterprises accounted for 0.4 percent.
Of the total number of persons employed, those in domestic funded enterprises accounted for 94.8 percent, those in enterprises funded by investors from Hong Kong, Macao and Taiwan accounted for 2.6 percent, and those in foreign funded enterprises accounted for 2.6 percent. (Table 4-2)
Table 4-1 Number of Corporate Enterprises and Persons Employed in Wholesale and Retail Trade by Group
| Corporate Enterprises (10,000) | Persons Employed (10,000) | Total | 649.9 | 4008.2 | Wholesale | 354.2 | 2198.2 | Agricultural, Forestry, Animal Husbandry and Fishery Products | 20.9 | 133.9 | Food, Beverages and Tobaccos | 41.6 | 319.8 | Textiles, Wearing Apparel and Household Articles | 54.1 | 326.4 | Cultural, Sports Appliances and Equipments | 13.2 | 76.0 | Medicines and Medical Appliances | 12.5 | 158.6 | Mineral products, Building Materials and Chemical Products | 95.3 | 578.0 | Machinery, Hardware and Electronics | 79.4 | 432.4 | Trade Broker and Agency | 12.0 | 52.4 | Others | 25.3 | 120.7 | Retail Trade | 295.7 | 1810.0 | Integrated Retail | 28.8 | 348.1 | Food, Beverages and Tobaccos | 34.7 | 170.3 | Textiles, Wearing Apparel and Daily Consumer Articles | 34.7 | 182.8 | Cultural, Sports Appliances and Equipments | 18.0 | 89.3 | Medicines and Medical Appliances | 23.0 | 162.1 | Motor Vehicles, Motorcycles, Parts, Fuels and other power | 33.4 | 312.8 | Household Electric Appliances and Electronic Products | 38.0 | 187.5 | Hardware, Furniture and Interior Decoration Materials | 44.9 | 183.5 | Stalls, Non-shop and Other Retails | 40.4 | 173.5 |
Table 4-2 Number of Corporate Enterprises and Persons Employed in Wholesale and Retail Trade by Status of Registration
| Corporate Enterprises (10,000) | Persons Employed (10,000) | Total | 649.9 | 4008.2 | Domestic Funded Enterprises | 645.0 | 3799.1 | State-owned Enterprises | 1.5 | 47.4 | Collective-owned Enterprises | 2.8 | 26.9 | Shareholding Cooperative Enterprises | 0.6 | 4.1 | Joint Ownership Enterprises | 0.2 | 1.8 | Limited Liability Corporations | 66.6 | 712.7 | Shareholding Corporations Limited | 4.8 | 134.5 | Private Enterprises | 550.4 | 2763.3 | Other Enterprises | 18.1 | 108.6 | Enterprises Funded by Investors from Hong Kong, Macao and Taiwan | 2.5 | 103.4 | Foreign Funded Enterprises | 2.4 | 105.6 |
| |  |
2. Main Economic Indicators
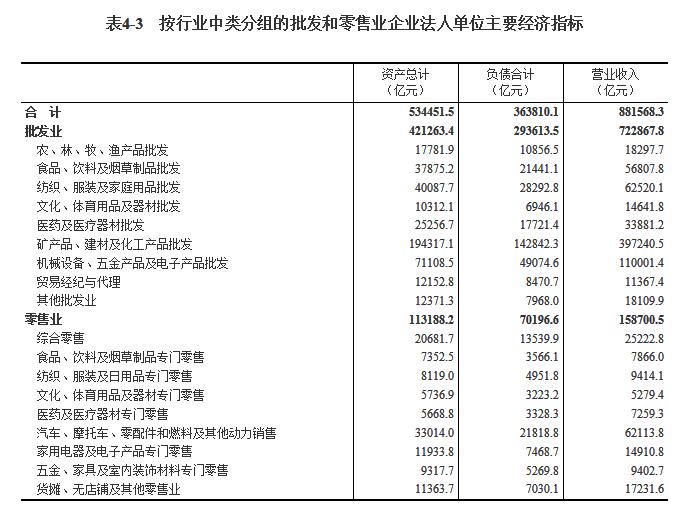
At the end of 2018, the total assets of the corporate enterprises engaged in wholesale and retail trade reached 53.44515 trillion yuan, an increase of 56.1 percent as compared with that at the end of 2013. Of the total, the assets of corporate enterprises in wholesale were 42.12634 trillion yuan, and that of corporate enterprises in retail trade were 11.31882 trillion yuan, up by 56.0 percent and 56.5 percent respectively over the end of 2013. The total liabilities were 36.38101 trillion yuan. The business revenue of the year reached 88.15683 trillion yuan. (Table 4-3)
Table 4-3 Main Economic Indicators of Corporate Enterprises in Wholesale and Retail Trade by Group
| Total Assets (100 million yuan) | Total Liabilities (100 million yuan) | Business Revenue (100 million yuan) | Total | 534451.5 | 363810.1 | 881568.3 | Wholesale | 421263.4 | 293613.5 | 722867.8 | Agricultural, Forestry, Animal Husbandry and Fishery Products | 17781.9 | 10856.5 | 18297.7 | Food, Beverages and Tobaccos | 37875.2 | 21441.1 | 56807.8 | Textiles, Wearing Apparel and Household Articles | 40087.7 | 28292.8 | 62520.1 | Cultural, Sports Appliances and Equipments | 10312.1 | 6946.1 | 14641.8 | Medicines and Medical Appliances | 25256.7 | 17721.4 | 33881.2 | Mineral products, Building Materials and Chemical Products | 194317.1 | 142842.3 | 397240.5 | Machinery, Hardware and Electronics | 71108.5 | 49074.6 | 110001.4 | Trade Broker and Agency | 12152.8 | 8470.7 | 11367.4 | Others | 12371.3 | 7968.0 | 18109.9 | Retail Trade | 113188.2 | 70196.6 | 158700.5 | Integrated Retail | 20681.7 | 13539.9 | 25222.8 | Food, Beverages and Tobaccos | 7352.5 | 3566.1 | 7866.0 | Textiles, Wearing Apparel and Daily Consumer Articles | 8119.0 | 4951.8 | 9414.1 | Cultural, Sports Appliances and Equipments | 5736.9 | 3223.2 | 5279.4 | Medicines and Medical Appliances | 5668.8 | 3328.3 | 7259.3 | Motor Vehicles, Motorcycles, Parts, Fuels and other power | 33014.0 | 21818.8 | 62113.8 | Household Electric Appliances and Electronic Products | 11933.8 | 7468.7 | 14910.8 | Hardware, Furniture and Interior Decoration Materials | 9317.7 | 5269.8 | 9402.7 | Stalls, Non-shop and Other Retails | 11363.7 | 7030.1 | 17231.6 |
| | 在批发和零售业企业法人单位中,内资企业占99.2%,港、澳、台商投资企业占0.4%,外商投资企业占0.4%。 |
| II. Transportation, Storage and Post | | 在批发和零售业企业法人单位从业人员中,内资企业占94.8%,港、澳、台商投资企业占2.6%,外商投资企业占2.6%(详见表4-2)。 |
1. Number of Corporate Enterprises and Persons Employed
At the end of 2018, there were 570 thousand corporate enterprises and 13.967 million persons employed in the transportation, storage and post industries, up by 126.2 percent and 12.0 percent respectively as compared with those at the end of 2013. (Table 4-4)
Table 4-4 Number of Corporate Enterprises and Persons Employed in Transportation, Storage and Post by Division
| Corporate Enterprises (10,000) | Persons Employed (10,000) | Total | 57.0 | 1396.7 | Railway Transport | 0.03 | 193.1 | Road Transport | 36.1 | 725.3 | Water Transport | 1.3 | 51.3 | Air Transport | 0.3 | 62.1 | Pipeline Transport | 0.03 | 3.1 | Multimodal Transport and Forwarding Agency | 9.6 | 100.5 | Loading, Unloading and Storage | 7.1 | 117.7 | Post | 2.6 | 143.7 |
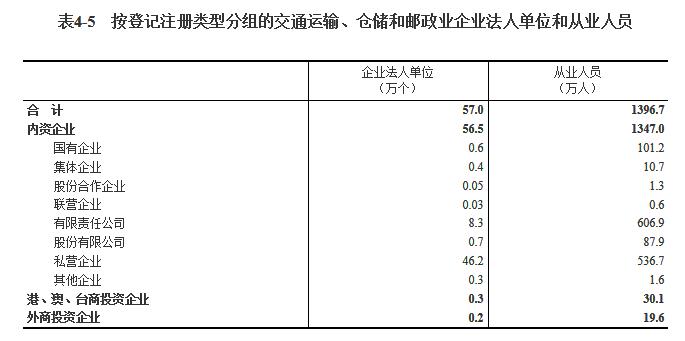
Of the total number of corporate enterprises engaged in transportation, storage and post, the domestic funded enterprises accounted for 99.1 percent, enterprises funded by investors from Hong Kong, Macao and Taiwan 0.5 percent, and foreign funded enterprises 0.4 percent.
Of the total number of persons employed, the proportion of those in domestic funded enterprises was 96.4 percent, those in enterprises funded by investors from Hong Kong, Macao and Taiwan 2.2 percent and those in foreign funded enterprises 1.4 percent. (Table 4-5)
Table 4-5 Number of Corporate Enterprises and Persons Employed in Transportation, Storage and Post by Status of Registration
| Corporate Enterprises (10,000) | Persons Employed (10,000 ) | Total | 57.0 | 1396.7 | Domestic Funded Enterprises | 56.5 | 1347.0 | State-owned Enterprises | 0.6 | 101.2 | Collective-owned Enterprises | 0.4 | 10.7 | Shareholding Cooperative Enterprises | 0.05 | 1.3 | Joint Ownership Enterprises | 0.03 | 0.6 | Limited Liability Corporations | 8.3 | 606.9 | Shareholding Corporations Limited | 0.7 | 87.9 | Private Enterprises | 46.2 | 536.7 | Other Enterprises | 0.3 | 1.6 | Enterprises Funded by Investors from Hong Kong, Macao and Taiwan | 0.3 | 30.1 | Foreign Funded Enterprises | 0.2 | 19.6 |
| | |
2. Main Economic Indicators
At the end of 2018, the total assets of the corporate enterprises engaged in transportation, storage and post reached 35,221.51 billion yuan, up by 86.7 percent over the end of 2013. The total liabilities were 21,366.36 billion yuan. The business revenue of the year reached 8,636.55 billion yuan. (Table 4-6)
Table 4-6 Main Economic Indicators of Corporate Enterprises in Transportation,Storage and Post by Division
| Total Assets (100 million yuan) | Total Liabilities (100 million yuan) | Business Revenue (100 million yuan) | Total | 352215.1 | 213663.6 | 86365.5 | Railway Transport | 82547.9 | 53361.4 | 8410.6 | Road Transport | 166195.2 | 100688.5 | 33233.9 | Water Transport | 23482.2 | 11658.5 | 6063.6 | Air Transport | 23292.9 | 12508.6 | 7372.8 | Pipeline Transport | 5509.7 | 1747.9 | 3030.8 | Multimodal Transport and Forwarding Agency | 13708.8 | 7753.1 | 13257.7 | Loading, Unloading and Storage | 32999.0 | 23440.8 | 9133.3 | Post | 4479.4 | 2504.7 | 5862.9 |
| | |
| III. Hotels and Catering Services | | (二)主要经济指标。 |
1. Number of Corporate Enterprises and Persons Employed
At the end of 2018, there were 431 thousand corporate enterprises engaged in hotels and catering services with total number of 7.064 million persons employed, up by 115.5 percent and 2.1 percent respectively as compared with those at the end of 2013.
Of the total number of corporate enterprises in hotels and catering services, hotels accounted for 29.1 percent and catering services accounted for 70.9 percent. Of the total number of persons employed, 38.8 percent worked in hotels and 61.2 percent in catering services. (Table 4-7)
Table 4-7 Number of Corporate Enterprises and Persons Employed in Hotels and Catering Services by Group
| Corporate Enterprises (10,000) | Persons Employed (10,000) | Total | 43.1 | 706.4 | Hotels | 12.6 | 274.0 | Tourism Hotels | 3.4 | 162.9 | Hostels | 7.7 | 95.6 | Homestay Service | 0.5 | 2.6 | Campsite Service | 0.01 | 0.1 | Others | 1.0 | 12.8 | Catering Services | 30.6 | 432.4 | Restaurants | 24.6 | 322.1 | Fast Food | 1.9 | 65.2 | Beverages and Cold Drinks | 0.9 | 13.3 | Food and Drink Delivery and Takeout Service | 0.6 | 12.5 | Others | 2.5 | 19.3 |
Table 4-8 Number of Corporate Enterprises and Persons Employed in Hotels and Catering Services by Status of Registration
| Corporate Enterprises (10,000) | Persons Employed (10,000) | Total | 43.1 | 706.4 | Domestic Funded Enterprises | 42.7 | 617.3 | State-owned Enterprises | 0.4 | 22.6 | Collective-owned Enterprises | 0.3 | 4.2 | Shareholding Cooperative Enterprises | 0.1 | 1.4 | Joint Ownership Enterprises | 0.02 | 0.5 | Limited Liability Corporations | 5.4 | 166.1 | Shareholding Corporations Limited | 0.4 | 15.5 | Private Enterprises | 36.0 | 405.9 | Other Enterprises | 0.2 | 1.2 | Enterprises Funded by Investors from Hong Kong, Macao and Taiwan | 0.2 | 43.1 | Foreign Funded Enterprises | 0.2 | 46.0 |
Of the total number of corporate enterprises in hotels and catering services, domestic funded enterprises accounted for 99.0 percent, enterprises funded by investors from Hong Kong, Macao and Taiwan 0.5 percent and foreign funded enterprises 0.5 percent.
Among the total number of persons employed, the proportion of those in domestic funded enterprises was 87.4 percent, that in enterprises funded by investors from Hong Kong, Macao and Taiwan 6.1 percent and foreign funded enterprises 6.5 percent. (Table 4-8)
Table 4-7 Number of Corporate Enterprises and Persons Employed in Hotels and Catering Services by Group
| Corporate Enterprises (10,000) | Persons Employed (10,000) | Total | 43.1 | 706.4 | Hotels | 12.6 | 274.0 | Tourism Hotels | 3.4 | 162.9 | Hostels | 7.7 | 95.6 | Homestay Service | 0.5 | 2.6 | Campsite Service | 0.01 | 0.1 | Others | 1.0 | 12.8 | Catering Services | 30.6 | 432.4 | Restaurants | 24.6 | 322.1 | Fast Food | 1.9 | 65.2 | Beverages and Cold Drinks | 0.9 | 13.3 | Food and Drink Delivery and Takeout Service | 0.6 | 12.5 | Others | 2.5 | 19.3 |
Table 4-8 Number of Corporate Enterprises and Persons Employed in Hotels and Catering Services by Status of Registration
| Corporate Enterprises (10,000) | Persons Employed (10,000) | Total | 43.1 | 706.4 | Domestic Funded Enterprises | 42.7 | 617.3 | State-owned Enterprises | 0.4 | 22.6 | Collective-owned Enterprises | 0.3 | 4.2 | Shareholding Cooperative Enterprises | 0.1 | 1.4 | Joint Ownership Enterprises | 0.02 | 0.5 | Limited Liability Corporations | 5.4 | 166.1 | Shareholding Corporations Limited | 0.4 | 15.5 | Private Enterprises | 36.0 | 405.9 | Other Enterprises | 0.2 | 1.2 | Enterprises Funded by Investors from Hong Kong, Macao and Taiwan | 0.2 | 43.1 | Foreign Funded Enterprises | 0.2 | 46.0 |
| | 2018年末,批发和零售业企业法人单位资产总计534451.5亿元,比2013年末增长56.1%。其中,批发业企业法人单位资产总计421263.4亿元,零售业企业法人单位资产总计113188.2亿元,分别比2013年末增长56.0%和56.5%。负债合计363810.1亿元。全年实现营业收入881568.3亿元(详见表4-3)。 |
2. Main Economic Indicators
At the end of 2018, the total assets of the corporate enterprises engaged in hotels and catering services reached 2,769.21 billion yuan, an increase of 35.3 percent as compared with that at the end of 2013. Of this total, the total assets of the corporate enterprises in hotels were 1,910.90 billion yuan and that of the corporate enterprises in catering services were 858.32 billion yuan, up by 39.0 percent and 27.8 percent respectively over the end of 2013. The total liabilities were 1,857.67 billion yuan. The business revenue of the year reached 1,365.09 billion yuan. (Table 4-9)
Table 4-9 Main Economic Indicators of Corporate Enterprises in Hotels and Catering Services by Group
| Total Assets (100 million yuan) | Total Liabilities (100 million yuan) | Business Revenue (100 million yuan) | Total | 27692.1 | 18576.7 | 13650.9 | Hotels | 19109.0 | 13246.1 | 5428.3 | Tourism Hotels | 13832.1 | 10072.8 | 3481.9 | Hostels | 4322.4 | 2556.8 | 1698.9 | Homestay Service | 224.9 | 122.6 | 38.7 | Campsite Service | 12.6 | 3.4 | 1.3 | Others | 716.9 | 490.5 | 207.6 | Catering Services | 8583.2 | 5330.6 | 8222.6 | Restaurants | 7163.5 | 4518.7 | 5939.0 | Fast Food | 717.9 | 396.0 | 1383.7 | Beverages and Cold Drinks | 267.6 | 163.0 | 329.2 | Food and Drink Delivery and Takeout Service | 149.5 | 84.2 | 270.7 | Others | 284.7 | 168.8 | 299.9 |
| |  |
| IV. Information Transmission, Software and Information Technology Services | | |
1. Number of Corporate Enterprises and Persons Employed
At the end of 2018, there were 913 thousand corporate enterprises engaged in information transmission, software and information technology services with a total number of 9.951 million persons employed, up by 316.2 percent and 84.5 percent respectively as compared with those at the end of 2013. (Table 4-10)
Table 4-10 Number of Corporate Enterprises and Persons Employed in Information Transmission, Software and Information Technology Services by Division
| Corporate Enterprises (10,000) | Persons Employed (10,000) | Total | 91.3 | 995.1 | Telecommunication, Radio & Television and Satellite Transmission Services | 2.5 | 174.7 | Internet and Related Services | 12.0 | 144.3 | Software and Information Technology Services | 76.8 | 676.2 |
Of the total number of corporate enterprises engaged in information transmission, software and information technology services, the proportion of domestic funded enterprises was 98.5 percent, that of enterprises funded by investors from Hong Kong, Macao and Taiwan 0.9 percent and foreign funded enterprises 0.6 percent.
Of the total number of persons employed, the proportion of those in domestic funded enterprises was 87.8 percent, that in enterprises funded by investors from Hong Kong, Macao and Taiwan 7.0 percent and in foreign funded enterprises 5.2 percent. (Table 4-11)
Table 4-11 Number of Corporate Enterprises and Persons Employed in Information Transmission, Software and Information Technology Services by Status of Registration
| Corporate Enterprises (10,000) | Persons Employed (10,000) | Total | 91.3 | 995.1 | Domestic Funded Enterprises | 90.0 | 873.8 | State-owned Enterprises | 0.1 | 9.1 | Collective-owned Enterprises | 0.1 | 0.5 | Shareholding Cooperative Enterprises | 0.03 | 0.2 | Joint Ownership Enterprises | 0.01 | 0.1 | Limited Liability Corporations | 13.1 | 262.3 | Shareholding Corporations Limited | 1.0 | 104.4 | Private Enterprises | 75.5 | 496.6 | Other Enterprises | 0.1 | 0.5 | Enterprises Funded by Investors from Hong Kong, Macao and Taiwan | 0.8 | 69.4 | Foreign Funded Enterprises | 0.5 | 52.0 |
| | 二、交通运输、仓储和邮政业 |
2. Main Economic Indicators
At the end of 2018, the total assets of the corporate enterprises engaged in information transmission, software and information technology services reached 15,202.55 billion yuan, up by 95.5 percent as compared with that at the end of 2013. The total liabilities were 7,186.35 billion yuan. The business revenue of the year reached 7,007.81 billion yuan. (Table 4-12)
Table 4-12 Main Economic Indicators of Corporate Enterprises in Information Transmission, Software and Information Technology Services by Division
| Total Assets (100 million yuan) | Total Liabilities (100 million yuan) | Business Revenue (100 million yuan) | Total | 152025.5 | 71863.5 | 70078.1 | Telecommunication, Radio & Television and Satellite Transmission Services | 58732.7 | 21837.0 | 18610.2 | Internet and Related Services | 25800.4 | 15257.9 | 17424.0 | Software and Information Technology Services | 67492.4 | 34768.6 | 34043.8 |
| | |
| V. Financial Intermediation | | (一)企业法人单位数和从业人员。 |
1. Number of Corporate Enterprises and Persons Employed
At the end of 2018, there were 137 thousand corporate enterprises engaged in financial intermediation with a total number of 18.180 million persons employed. (Table 4-13)
Table 4-13 Number of Corporate Enterprises and Persons Employed in Financial Intermediation by Division
| Corporate Enterprises (10,000) | Persons Employed (10,000) | Total | 13.7 | 1818.0 | Monetary Finance Services | 3.9 | 414.8 | Capital Market Services | 6.7 | 67.3 | Insurance | 1.8 | 1308.0 | Others | 1.4 | 28.0 |
Note: Corporate enterprises in financial intermediations include those under the supervision of the People's Bank of China, China Banking and Insurance Regulatory Commission and China Securities Regulatory Commission and those beyond the supervision but engaged in financial intermediation. | | 2018年末,全国共有交通运输、仓储和邮政业企业法人单位57.0万个,从业人员1396.7万人,分别比2013年末增长126.2%和12.0%(详见表4-4)。 |
2. Main Economic Indicators
At the end of 2018, the total assets of the corporate enterprises engaged in financial intermediation reached 321,830.90 billion yuan, and the total liabilities were 274,343.96 billion yuan. The business revenue of the year reached 13,718.59 billion yuan. (Table 4-14)
Table 4-14 Main Economic Indicators of Corporate Enterprises in Financial Intermediation by Division
| Total Assets (100 million yuan) | Total Liabilities (100 million yuan) | Business Revenue (100 million yuan) | Total | 3218309.0 | 2743439.6 | 137185.9 | Monetary Finance Services | 2642776.1 | 2416218.1 | 70426.9 | Capital Market Services | 223257.5 | 108405.4 | 8564.3 | Insurance | 184159.4 | 163461.6 | 45734.9 | Others | 168116.0 | 55354.5 | 12459.8 |
Note: Corporate enterprises in financial intermediations include those under the supervision of the People's Bank of China, China Banking and Insurance Regulatory Commission and China Securities Regulatory Commission and those beyond the supervision but engaged in financial intermediation. | | 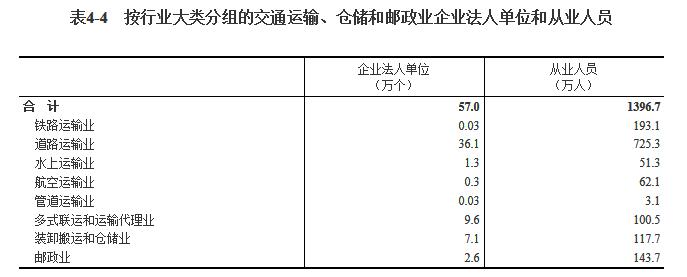 |
| VI. Real Estate | | 在交通运输、仓储和邮政业企业法人单位中,内资企业占99.1%,港、澳、台商投资企业占0.5%,外商投资企业占0.4%。 |
1. Number of Corporate Enterprises and Persons Employed
At the end of 2018, there were 742 thousand corporate enterprises engaged in real estate in China, an increase of 119.5 percent as compared with that at the end of 2013. Of this total, the number of enterprises for real estate development and management was 206 thousand, that for property management 234 thousand and that for real estate intermediary services 206 thousand, up by 55.6 percent, 122.8 percent and 212.7 percent respectively as compared with those at the end of 2013.
At the end of 2018, there were 12.635 million persons employed by the corporate enterprises in real estate, up by 44.0 percent as compared with that at the end of 2013. Of this total, the number of persons employed in real estate development and management enterprises was 3.715 million, that in property management 6.369 million, and that in real estate intermediary services 1.583 million, up by 10.9 percent, 54.8 percent and 103.9 percent respectively over the end of 2013. (Table 4-15)
Table 4-15 Number of Corporate Enterprises and Persons Employed in Real Estate by Group
| Corporate Enterprises (10,000) | Persons Employed (10,000) | Total | 74.2 | 1263.5 | Real Estate Development and Management | 20.6 | 371.5 | Property Management | 23.4 | 636.9 | Real Estate Intermediary Services | 20.6 | 158.3 | Real Estate Leasing and Management | 8.2 | 85.9 | Others | 1.4 | 10.9 |
| | 在交通运输、仓储和邮政业企业法人单位从业人员中,内资企业占96.4%,港、澳、台商投资企业占2.2%,外商投资企业占1.4%(详见表4-5)。 |
2. Main Economic Indicators
At the end of 2018, the total assets of the corporate enterprises engaged in real estate sector reached 115,948.75 billion yuan, an increase of 120.5 percent as compared with that at the end of 2013. Of the total, the assets of enterprises for real estate development and management were 100,594.74 billion yuan, that of property management 3,066.67 billion yuan, and that of real estate intermediary services 1,330.52 billion yuan, up by 112.0 percent, 124.4 percent and 142.4 percent respectively as compared with that at the end of 2013. The total liabilities were 88,948.92 billion yuan. The business revenue of the year reached 14,369.60 billion yuan. (Table 4-16)
Table 4-16 Main Economic Indicators of Corporate Enterprises in Real Estate by Group
| Total Assets (100 million yuan) | Total Liabilities (100 million yuan) | Business Revenue (100 million yuan) | Total | 1159487.5 | 889489.2 | 143696.0 | Real Estate Development and Management | 1005947.4 | 787264.7 | 125718.4 | Property Management | 30666.7 | 21627.7 | 9066.1 | Real Estate Intermediary Services | 13305.2 | 9756.8 | 3277.6 | Real Estate Leasing and Management | 92173.9 | 58328.6 | 4997.6 | Others | 17394.3 | 12511.4 | 636.3 |
| |  |
| VII. Leasing and Business Services | | |
1. Number of Corporate Enterprises and Persons Employed
At the end of 2018, there were 2.506 million corporate enterprises engaged in leasing and business services with total employment of 22.368 million people, up by 207.5 percent and 84.0 percent respectively as compared with those at the end of 2013.
Of the total number of corporate enterprises in leasing and business services, leasing accounted for 8.9 percent and business services accounted for 91.1 percent. Of the total number of persons employed, 6.3 percent worked in leasing and 93.7 percent in business services. (Table 4-17)
Table 4-17 Number of Corporate Enterprises and Persons Employed in Leasing and Business Services by Division
| Corporate Enterprises (10,000) | Persons Employed (10,000) | Total | 250.6 | 2236.8 | Leasing | 22.4 | 140.3 | Business Services | 228.2 | 2096.5 |
Of the total number of corporate enterprises engaged in leasing and business services, the proportion of domestic funded enterprises was 99.0 percent, enterprises funded by investors from Hong Kong, Macao and Taiwan 0.6 percent and foreign funded enterprises 0.4 percent.
Of the total number of persons employed, the proportion of those in domestic funded enterprises was 97.2 percent, that in enterprises funded by investors from Hong Kong, Macao and Taiwan 1.2 percent and that in foreign funded enterprises 1.5 percent. (Table 4-18)
Table 4-18 Number of Corporate Enterprises and Persons Employed in Leasing and Business Services by Status of Registration
| Corporate Enterprises (10,000) | Persons Employed (10,000) | Total | 250.6 | 2236.8 | Domestic Funded Enterprises | 248.2 | 2174.9 | State-owned Enterprises | 1.0 | 69.6 | Collective-owned Enterprises | 17.0 | 69.1 | Shareholding Cooperative Enterprises | 0.2 | 3.5 | Joint Ownership Enterprises | 0.1 | 1.4 | Limited Liability Corporations | 34.3 | 524.7 | Shareholding Corporations Limited | 2.1 | 43.5 | Private Enterprises | 187.4 | 1429.0 | Other Enterprises | 6.1 | 34.2 | Enterprises Funded by Investors from Hong Kong, Macao and Taiwan | 1.5 | 27.4 | Foreign Funded Enterprises | 0.9 | 34.6 |
| | (二)主要经济指标。 |
2. Main Economic Indicators
At the end of 2018, the total assets of the corporate enterprises engaged in leasing and business services reached 110,825.31 billion yuan, up by 105.4 percent as compared with that at the end of 2013. Of the total, the assets of enterprises for leasing were 1,532.01 billion yuan, and that of enterprises for business services were 109,293.29 billion yuan, up by 102.3 percent and 105.4 percent respectively as compared with that at the end of 2013. The total liabilities were 58,426.55 billion yuan. The business revenue of the year reached 8,540.49 billion yuan. (Table 4-19)
Table 4-19 Main Economic Indicators of Corporate Enterprises in Leasing and Business Services by Division
| Total Assets (100 million yuan) | Total Liabilities (100 million yuan) | Business Revenue (100 million yuan) | Total | 1108253.1 | 584265.5 | 85404.9 | Leasing | 15320.1 | 9764.2 | 4915.6 | Business Services | 1092932.9 | 574501.3 | 80489.3 |
| | 2018年末,交通运输、仓储和邮政业企业法人单位资产总计352215.1亿元,比2013年末增长86.7%。负债合计213663.6亿元。全年实现营业收入86365.5亿元(详见表4-6)。 |
| Note: | | 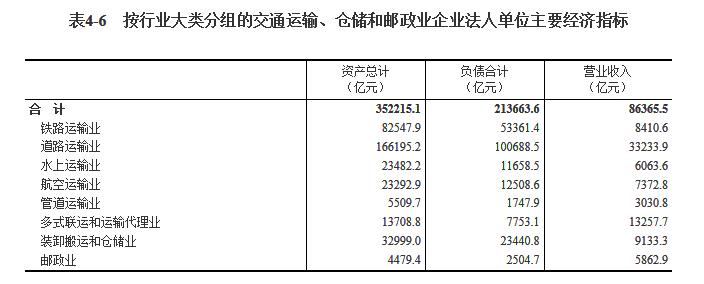 |
| [1] Corporate enterprises in the Communiqué include the legal entities registered as enterprises, as well as institutions, private non-enterprise legal entities and foundations that follow the Accounting System for Business Enterprises, specialized farmer cooperatives, rural collective economic organizations and legal entities that are categorized as other organizations excluding places for religious activities. | | |
| [2] No mechanical adjustment is made for the round-off errors in aggregate totals or part of the calculations in the tables. | | 三、住宿和餐饮业 |
| | |
| | (一)企业法人单位数和从业人员。 |
| | 2018年末,全国共有住宿和餐饮业企业法人单位43.1万个,从业人员706.4万人,分别比2013年末增长115.5%和2.1%。
...... |
| | |
您好:您现在要进入的是北大法宝英文库会员专区。
如您是我们英文用户可直接 登录,进入会员专区查询您所需要的信息;如您还不是我们 的英文用户;您可通过网上支付进行单篇购买,支付成功后即可立即查看本篇内容。
Tel: +86 (10) 82689699, +86 (10) 82668266 ext. 153
Mobile: +86 13311570713
Fax: +86 (10) 82668268
E-mail:info@chinalawinfo.com
|
| | | | | | | | |
Scan QR Code and Read on Mobile
|
|
|
|
|
|
Message: Please kindly comment on the present translation.
|
|
|
|
|
|
|
|
|
Translations are by lawinfochina.com, and we retain exclusive copyright over content
found on our website except for content we publish as authorized by respective copyright
owners or content that is publicly available from government sources.
Due to differences in language, legal systems, and culture, English translations
of Chinese law are for reference purposes only. Please use the official Chinese-language
versions as the final authority. Lawinfochina.com and its staff will not be directly
or indirectly liable for use of materials found on this website.
We welcome your comments and suggestions, which assist us in continuing to improve
the quality of our materials as we dynamically expand content.
|
|
|
|
|
|